Nematophagous fungi – study by fluorescence microscopy and EDX-technique of the periodicity of trap formation in soil.
by Chr. H. Jensen, H. G. Neumeister* and G. Lysek
Institute of Systematic Botany and Plant Geography, Free University of Berlin, Altensteinstr. 6; D-14195 Berlin.
Key words: fluorescence microscopy, EDX-technique, SEM, nematophagous fungi, trap formation, periodicity, soil fungi, Arthrobotrys oliqospora
Summary:
The recently developed method of studying fungi inside soil by fluorescence microscopy was used to examine the periodism of trap formation by predacious fungi. Therefore, this method was supplemented by a technique, which also permitted serial sections of the soil and the counting of capture organs of Arthrobotrys oliqospora in the soil.
In combination these methods also allowed spotting of the traps at their exact location, thus giving evidence about their spatial, three dimensional pattern and demonstrating the relative predatory success in soil. It was shown that in spite of a virtually homogeneous induction by the eelworms the distribution is distinctly periodical. A period of 29,65 + 4.14 h was calculated. Additional EDX-measurements of the mycelia showed maxima of mineral content, the distance of which agreed with the period length observed. These mineral accumulations obviously marked the sites of potential trap formation.
Introduction
The nematode-capturing Deuteromycete Arthrobotrys oliqospora has been used as the main object to study the physiology, ecology and biochemistry of these predatory fungi (NORDBRING-HERTZ, 1988) During these studies methods were developed to induce trap formation either by living eelworms on by chemical or physical means (NORDBRING-HERTZ, 1968 and pers. comm.).
In all these cases the capture organs formed on agar media were not distributed evenly or randomized on the cultures, but showed sites with markedly increased numbers of traps beside areas with few or even without any traps. These sites of heavy trap formation most often were distributed so as to give the image of concentric rings, or periodically formed bands (LYSEK & NORDBRINGHERTZ, 1981). It was shown by CZESNY & LYSEK (1985), that other species of predatory fungi reacted likewise.
The similarity of this arrangement to the typical fungal rhythms, which are expressed by concentric bands of dense mycelia, conidiophores or fruiting organs is obvious (FELDMAN & HOYLE, 1974; JENSEN & LYSEK, 1983; LYSEK, 1974, 1984). The period length observed adds to this similarity as often values differing from 24 h are measured.
Fluorescence microscopy of these fungi in the soil now allowed investigation of this phenomenon inside the natural habitat and also – after development of adequate preparation methods – to look for the three-dimensional pattern. The results underlined the hitherto known periodic distribution – and even allowed some considerations about the ecology of this pattern.
Materials and methods
Fungus
As in previous studies, Arthrobotrys oliqospora, strain Lund (ATCC 24927) was used in these experiments. The fungus grew well and developed capture organs in agar cultures as well as in pre-sterilized soil media (JENSEN & LYSEK, 1995). As shown by JENSEN & LYSEK (1991; see also SAXENA & LYSEK, 1993; JENSEN, 1994) the fungus grew, sporulated and captured nematodes in the native soil like it is known from petri-dish cultures.
Culture and preparation of samples
The fungus was grown for pre-cultures, scanning electron microscopy and EDX-measurements on malt extract (1 % malt extract Difco L39, 2 % agar-agar Oxide L13, 0.1 g KOH Merck 5032 ad 1000 ml aqua dest w/v). For the experiments the fungus was grown in sterilized compost to avoid any effect of soil fungistasis. The cultures were inoculated by adding stripes cut out from agar cultures of Arthrobotrys oliqospora to a straight line of about 2 – 3 cm near the edge of the petri dish (fig. 2a); this resulted in a more or less straight mycelial front on and inside the soil substrate.
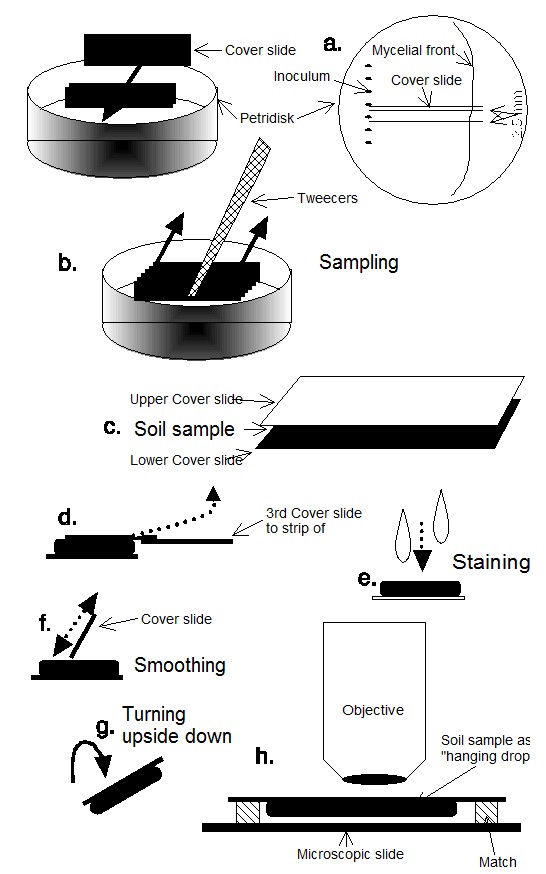
After 14 days of growth a number of cover slides 60 x 24 mm² were inserted vertically into the soil and perpendicular to the mycelial front. The distance between two pairs of slides – and thus the thickness of the soil samples cut out – was 2,5 mm; the soil samples showed cross sections of the hyphal front and longitudinal sections of the radially growing mycelium (fig. 2c). The test-objects (up to 10) were removed (Fig. 2b) and stained immediately afterwards (fig. 2d-f). This was done very carefully to maintain the soil sample and with it the mycelium and the traps undisturbed. In a similar way, horizontal sections – showing the different layers of the culture – were obtained after removing part of the soil from the dish to allow insertion of the cover slides.
Fluorescence microscope
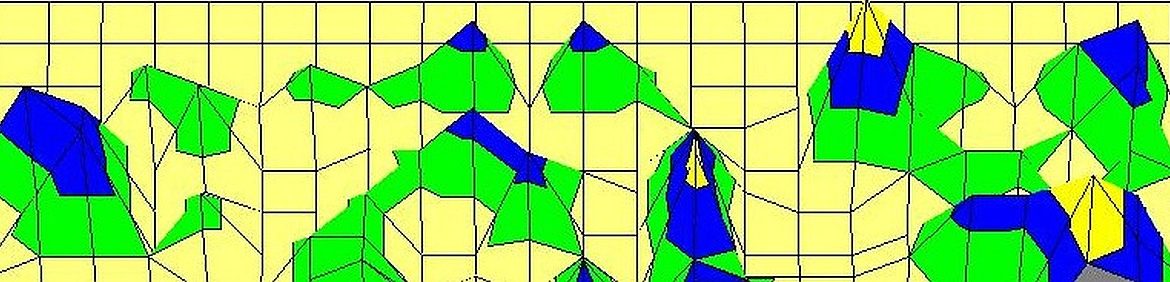
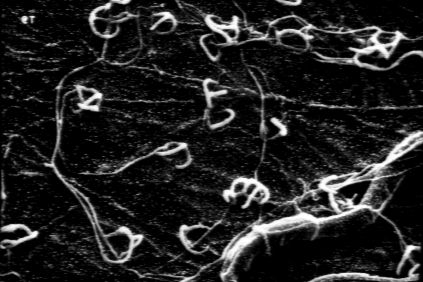
The evaluation of the samples was done using the technique of the „hanging drop“ described by JENSEN & LYSEK (1991) and JENSEN (1994) (fig. 2 g, h). The metabolically very active capture organs were stained with the vital fluorescence stain fluoresceine-di-acetate (FDA). The FDA accumulates inside the living hyphae (only) and later undergoes hydrolysis. Only the fluoresceine cleaved off sends out fluorescence. Thus, metabolically active parts – like the traps – can be examined in the microscope. This allows an easy spotting and counting of capture organs with and without nematodes. Alternatively the optical brightener Calcofluor W, which binds to the cellulose- and chitin-moieties of the hyphal walls (SENGBUSCH 1983), was used. It did not show the rapid fading of FDA, so that microscopy of the samples was still possible even after one or two days. Serial sections therefore were routinely stained with Calcofluor W, because the large number of samples needed several hours to be analyzed. The traps observed were mapped according to number and site in specially designed sheets.
EDX-measurements.
After 6 days of incubation at 21º C pieces of 5 x 5-6 mm were cut out and mounted on the SEC sample stage, fixed with liquid carbon glue and shock-frozen in liquid nitrogen, lyophilized and sputtered. The equipment used was a Stereoscan 90B/100 SE microscope of Cambridge Instruments Ltd.
For EDX-measurements the samples were fixed to the sample holders and then dried at room temperature for 2 h. After sputtering with gold the samples were directly used for EDX measurements which were made with an energydispersive X-ray microanalysis equipment „AN 1000“ mounted on the Stereoscan SE microscope as given above (Fa. Link – now Oxford Instruments Ltd.). For details of EDX and SEM see NEUMEISTER (1994).
Results and discussion.
1. Density and success of capture organs
Table 1 shows the results of the counting of 45 serial cuts, each of which was about 1 cm broad (deep!) and 4 cm long, thus giving a total area of 180 cm². Since the values differed markedly between these experiments, the figures can only be regarded as approximations. On the other hand, these differences underline the uneven distribution of the traps produced after induction by living nematodes. The results, therefore, can be regarded as representative.
Cuts of 5 independent experiments |
45 |
Capture organs counted |
1969 |
of these with nematodes |
438 |
relative predatory success |
22,24 |
Area searched for capture organs |
180 cm² |
Traps per unit area (1 cm²) |
11 |
Estimated soil volume observed (assumed: 0.2 to 0.5 mm depth accessable for study) |
3.9 - 9 cm³ |
Traps per 1 cm³ |
220 - 550 |
|
Tab. 1: Estimation of the observed traps inside the soil samples. The values reflect the results of 5 independent experiments. |
The values obtained give 220 – 550 traps per cm³, 22 % of which already have captured nematodes. These numbers demonstrate an obviously successful system, which explains the figures of more than 90 % of the free living nematodes in a soil killed permanently obtained by KERRY (1984).
2. Pattern of distribution of capture organs
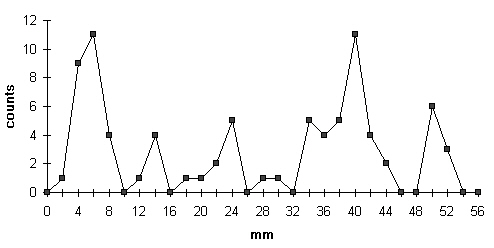
3 a: Mean of all values obtained, shown on a radial line from inoculum (origin) to the mycelial front (right end).
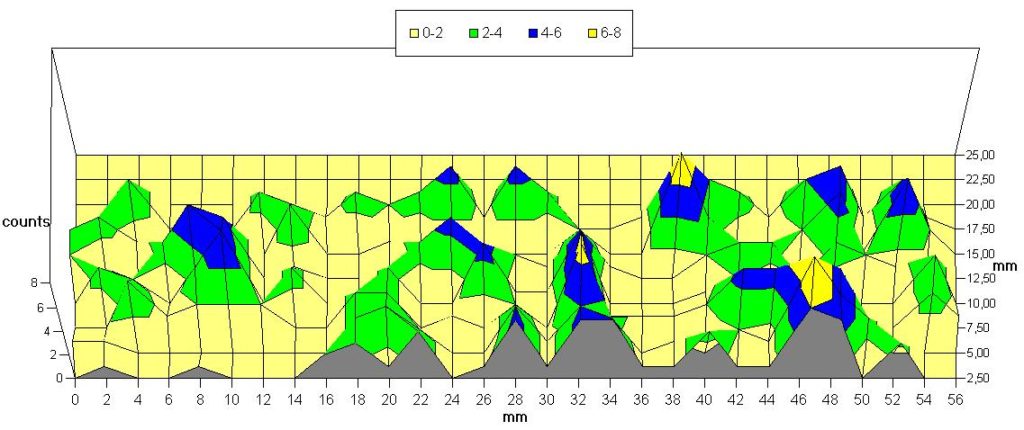
Fig. 3 shows the distribution (mean of all evaluated countings) of traps near the surface on a radial section. This resembles the former studies with agar cultures (LYSEK & NORDBRING-HERTZ, 1981; CZESNY & LYSEK, 1985) – however autoclaved soil (see materials & methods) was used here. This shows that the periodicity of the distribution of the traps is found also inside soil cultures: In serial sections yielding the three-dimensional distribution a similar inhomogeneity is found. In 45 sections – of which 31 showed a very clear picture – a periodicity was obvious. Counting and evaluation indicate a period length of 23,3 to 36,5 h (mean 29,65; standard deviation 4,14). See also tab 2.
Tab. 2:
Experiment Period length in the subsequent sections Mean±s (h)
No (2,5 mm apart – see materials and methods)
| „067“ | 31,50 | 25,70 | 28,60 | 24,20 | 23,30 | 25,10 | 30,80 | 30,80 | 37,40 | 24,90 | 28,23 | 4,42 |
| „081“ | 33,60 | 27,10 | 32,10 | 31,00 | 35,80 | 30,00 | 37,10 | 32,90 | 32,45 | 3,19 | ||
| „083“ | 34,80 | 36,50 | 24,00 | 24,00 | 26,10 | 31,80 | 29,30 | 29,50 | 5,07 | |||
| „084“ | 30,60 | 25,50 | 30,60 | 27,70 | 28,60 | 2,48 | ||||||
| „103“ | 29,25 | 27,00 | 28,13 | 1,59 |
Total mean ± standard deviation (h) 29.65±4.14
Whether this is a genuine endogenous rhythm comparable to the periodicity found by LYSEK & NORDBRING-HERTZ (1981) cannot be decided at present. However, it is obvious that the traps formed after induction by nematodes are distributed in a distinct pattern – concentric rings or bands – obviously governed by underlying periodicity. This is found even if sufficient nematodes are added to warrant a homogeneous and randomized pattern of induction – with only a gradient from the surface to the deeper layers conceivable. The results thus give clear evidence for a periodic sensitivity for induction of trap formation of the mycelium of Arthrobotrys oliqospora.
3. EDX-analysis of mycelium
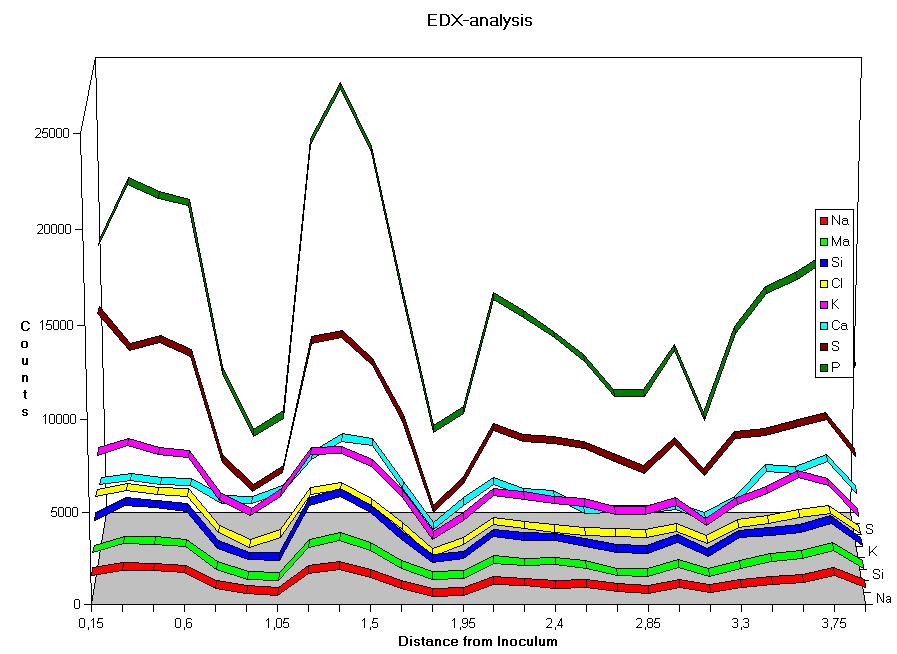
Sensitivity of hyphae to physical alterations – in this case the mechanical touch by the moving nematodes – was found to be connected with the contents of inorganic ions of the hyphae. The X-ray analysis of the mycelium therefore was thought to give more evidence. Fig. 4 shows the results of serial measurements along a radius from the inoculum to the hyphal front of Arthrobotrys oliqospora ; the colony had not been induced to form traps, i. e. no nematodes had been added.
The results show a clear periodism. All measured elements show 4 peaks. Since the mycelium had grown 5 days at a rate of about 8 mm per day, this represents the period length of about 30 h, which corresponds to the 29.65±4,14 h calculated above.
Discussion
This observation may thus be regarded as another example of fungal rhythms in the form of concentric bands. It prompts the questions as to its endogenous or exogenous nature and concerning its evolutionary or ecological advantage. An endogenous nature might be assumed due to the period length which does not correspond to that of any known environmental trigger.
As for the ecological value only speculations are possible at the moment. It may be concluded from the existing data that the induction of capture organs by living eelworms requires the hyphae to be continuously in a state of alertness. Independently of the type of the trigger, the alertness as well as the initial reactions demand energy provided by the metabolism. Thus, keeping only small areas of the mycelium in a state of alertness would allow the hyphae to economize the input of metabolic energy without reducing the effect: the nematodes moving around would sooner or later hit also the „hot spots“, induce trap formation and hence capture of sufficient animals to provide the metabolism with resources to start trap formation again – in part even in the hitherto not reacting parts of the mycelium.
On the other hand the results also give evidence that the typical fungal rhythms have a distribution wider than expected hitherto (and more importance than assumed?). Created by differences in the development or developmental potential along the axis from the origin to the front of the mycelium, these rhythms cause the formation of concentric bands of visible structures like conidiophores or fruiting organs. The example of trap formation now gives evidence that further structures formed by mycelia may be organized in periodic patterns.
References
CZESNY, C. & G. LYSEK (1985): Distribution of induced traps in cultures of nematode trapping soil fungi.
Nordic Journal of Botany 5, 377 – 380.
FELDMAN, J. F. & M. N. HOYLE (1974): A direct comparison between circadian and noncircadian rhythms in Neurospora crassa.
Plant Physiology 53, 928 – 930.
JENSEN, C. (1994): Fluoreszenzmikroskopische Möglichkeiten zur in situ-Beobachtung nematophager Pilze im Boden.
Dissertationes Botanicae 217; J. Cramer Verlag Berlin, Stuttgart.
JENSEN, C. & G. LYSEK (1983): Differences in the mycelial growth rhythms in a population of Sclerotinia fructiqena (Pers.) Schröter.
Experientia 39, 1401 – 1402.
JENSEN, C. & G. LYSEK (1991): Direct observation of trapping activities of nematode-destroying fungi in the soil using fluorescence microscopy.
FEMS Microbiology Ecology 85, 207-210.
JENSEN, C. & G. LYSEK (1995): Fluorescence microscopy of fungi in native soil – improvements by additional substances.
Microscopy and Analysis 1 – 9, Sept. 1995.
KERRY, B. R. (1984): Nematophagous fungi and the regulation of nematode populations in soil.
Helminthological Abstracts 53, 1 – 14.
LYSEK, G. (1974): Zonierungen und Hexenringe: Morphologische Differenzierungen bei Pilzen.
Naturwissenschaftliche Rundschau 27, 449 – 455.
LYSEK, G. (1984): Physiology and ecology of rhythmic growth and fructification in fungi.
In: The Ecology and Physiology of the fungal mycelium. Symposia of the BMS.:
D. H. Jennings and A. D. M. Rayner eds; Cambridge Univ. Press 223 – 342.
LYSEK, G. & B. NORDBRING-HERTZ (1981): An endogenous rhythm of trap formation in the nematophagous fungus Arthrobotrys oliqospora.
Planta 152, 50 – 53.
NEUMEISTER, H. (1994): Entwicklung einer Präparationstechnik für die Energie-dispersive Röntgen-Mikroanalyse am Beispiel Arthrobotrys oliqospora.
Berichte aus der Biologie, Shaker Verl. Aachen.
NORDBRING-HERTZ, B. (1968): The influence of composition and addition of animal origin on the formation of capture organs in Arthrobotrys oliqospora.
Physiologia Plantarum 21, 52 – 65.
NORDBRING-HERTZ, B. (1988): Nematophagous fungi: strategies for nematode exploitation and for survival.
Microbiological Sciences 5, 108 – 116.
SAXENA, G. & G. LYSEK (1993): Observations of nematophagous fungi in natural soils by fluorescence microscopy and their correlation with isolation.
Mycological Research 97, 1005 – 1011.
SENGBUSCH, P., Hechler, J. & Müller, V. (1983): Molekular architecture of fungal cell walls. An approach by use of fluorescent markers.
Europ. J. of Cell Biology 30, 305-312.