Christian Jensen, Heike Neumeister and Gernot Lysek
Free University Berlin
Published in “Mycologist” Vol 12, Part 3, August 1998, pp 107 – 111
reproduced here with kind permission of R. T. Moore (BMS, www.bms.ac.uk).
Abstract:
Fluorochroming of soil samples makes it possible to study soil fungi in their natural habitat. This is demonstrated with some nematophagous (predacious) fungi.
Key words:
Fluorescence techniques, soil fungi, nematophagous fungi, FDA, calcofluor W
Introduction:
Fluorescence techniques have become an effective tool in microscopy. With the help of sophisticated equipment and an increasing number of fluorochromes, it is now possible to observe and differentiate a range of materials, microorganisms, electric, water or redox potentials and even living and dead cells or tissues. Most of the fluorochromes also allow the unrestricted observation of living cells.
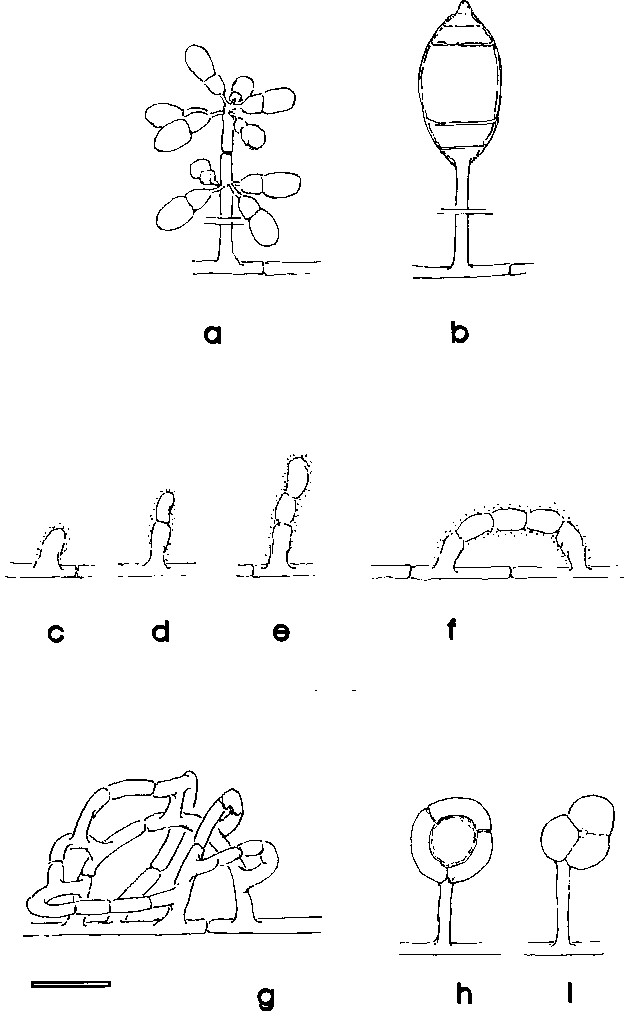
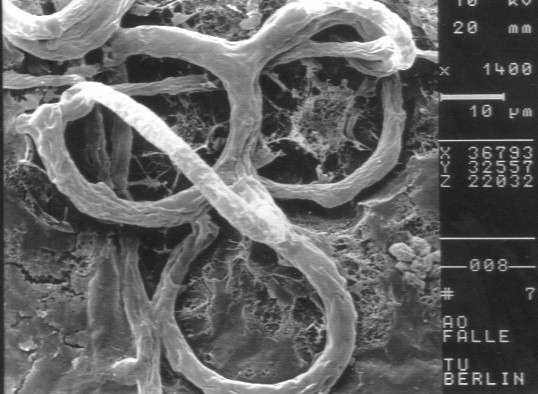
Fluorescence microscopy has now been successfully adapted to observe soil-dwelling fungi in situ (JENSEN 1994; JENSEN & LYSEK 1991; SAXENA & LYSEK 1993). This has been made possible by the use of specific fluorochromes such as fluorescein-di-acetate (FDA), which stains actively metabolizing cells or hyphae, and calcofluor white, which marks the hyphal walls. Here, we present the results of the observation of soil-dwelling, predacious (mainly nematophagous) fungi. This ecological group can in part be well characterized by the morphology of their spores (Monacrosporium or Arthrobotrys-type) and also by the presence of specific capture organs, which are often associated with the remains of captured nematodes. To give a better overview and to allow a comparison of fluorescence and conventional microscopical images, these structures are given as schemes in fig 1. In addition fig. 2 shows a scanning electron microscopic view of the typical capture organ of Arthrobotrys oligospora (Fres.), the nematophagous hyphomycete on which most of our experiments were based and which is common in many types of soils (NORDBRING-HERTZ 1988).
Materials and methods:
Soils
We used sterilized compost to avoid any effect of soil fungistasis and inoculated the fungi from pre-cultures on malt extract agar plates. Incubation was done in petridisks at room temperature.
Fluorochroming:
For this study, we used two stains, as follows.
Fluorescein-di-acetate (FDA):
This substance itself does not give any fluorescence; rather it is taken up by actively metabolizing cells or hyphae, where it is hydrolyzed enzymatically to yield free fluoresceine, a true fluorochrome. Thus only living and actively metabolizing microorganisms become visible when stained with FDA (SÖDERSTRÖM & ERLAND 1986; CORREN et al. 1986; JENSEN 1994).
For our experiments a stock solution was prepared from 500 mg FDA dissolved in 100 ml acetone and stored at -18 ° C. A working solution was prepared by diluting 0.1 ml of the stock solution in 5 ml 60 mM phosphate buffer pH 6.88. Since it degraded very rapidly, the working solution was freshly prepared for every observation. This solution was mixed into the soil and microscopic observation started immediately; images were visible one minute after preparation. Due to the rapid photofading of fluoresceine, staining lasted not longer than 20 minutes.
Calcofluor White:
This stain (correct name „Calcofluor white M2R new“) is an optical brightener with a high affinity to B-1,4-glucans such cellulose or chitin. It is thus specific for hyphal walls, it does not differentiate between living and dead tissue. Calcofluor stains many types of fungal structures, for example spores or fruiting body initials (VON SENGBUSCH 1983; COHEN et al. 1987). A stock solution was prepared from 50 mg calcofluor dissolved in 5 ml buffer (TRIS pH 9,0). The working solution consisted of 0.1 ml of stock solution in 9.9 ml buffer. Both solutions are stable and were stored in the dark at room temperature. For microscopic observations, the working solution was simply mixed with the soil to be investigated immediately prior to observation. The fluorescence was very stable, for example, mounts kept in a wet chamber could be studied for at least 24 h after staining.
Treatment of soil samples
In order to preserve the exact localization of hyphae, traps, or other specific structures and surrounding soil particles, the soil samples had to be treated very carefully. Soil samples were cut vertical from the surface to the ground of the petridisk with cover slides to get a number of soil slides with a depth of 2.5mm in average. Each soil slide was placed on one cover slide. Staining and manipulation were done with much care to avoid distortion of the native structure. Observation was best through the slide in the hanging drop technique (JENSEN 1994; JENSEN & LYSEK 1995).
Microscopic and photographic equipment:
Observations were made using a Leitz Dialux 20 research microscope equipped with an (epi-)fluorescence illuminator PLOEMOPAK 2.4 supplied with a mercury lamp HBO 50 W (Osram). The filter blocks used were A, E3, I3 and N2 (JENSEN 1994). Photographs were taken with a MPS 11 microscope camera connected with a MPS 15 semiphotomat (Wild). Kodak negative films of 100, 200, 400 and 1000 ASA were used.
SEM-photos were taken using a Cambridge stereoscan 90 B 100/SE scanning electron microscope; for details see NEUMEISTER (1994).
Results and discussion:
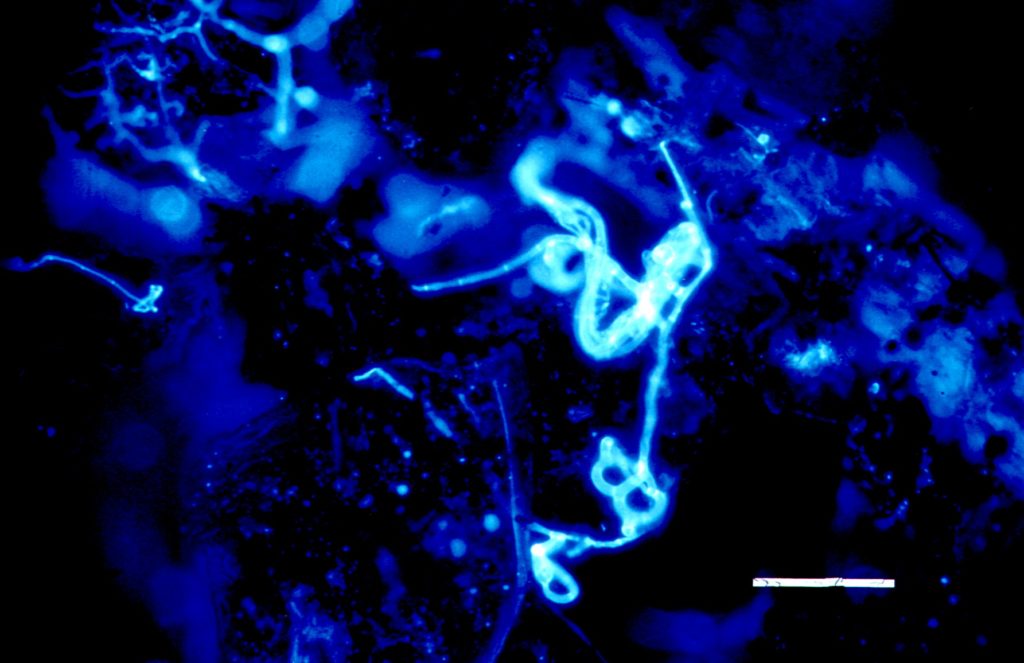
Fig. 3 shows calcofluor-stained fluorescence of a typical three-dimensional sticky network of A. oligospora hyphae between soil particles. The hyphae with the sticky network of the „trap“ as well as the digestive hyphae filling the empty corpse of a captured nematode are clearly visible. Due to the Calcofluor W staining, all hyphae give a similar fluorescence – a distinction of active or inactive hyphae is not possible. However, it may be assumed, at this state of degradation, that the digestive hyphae are only present as empty tubes of hyphal walls.
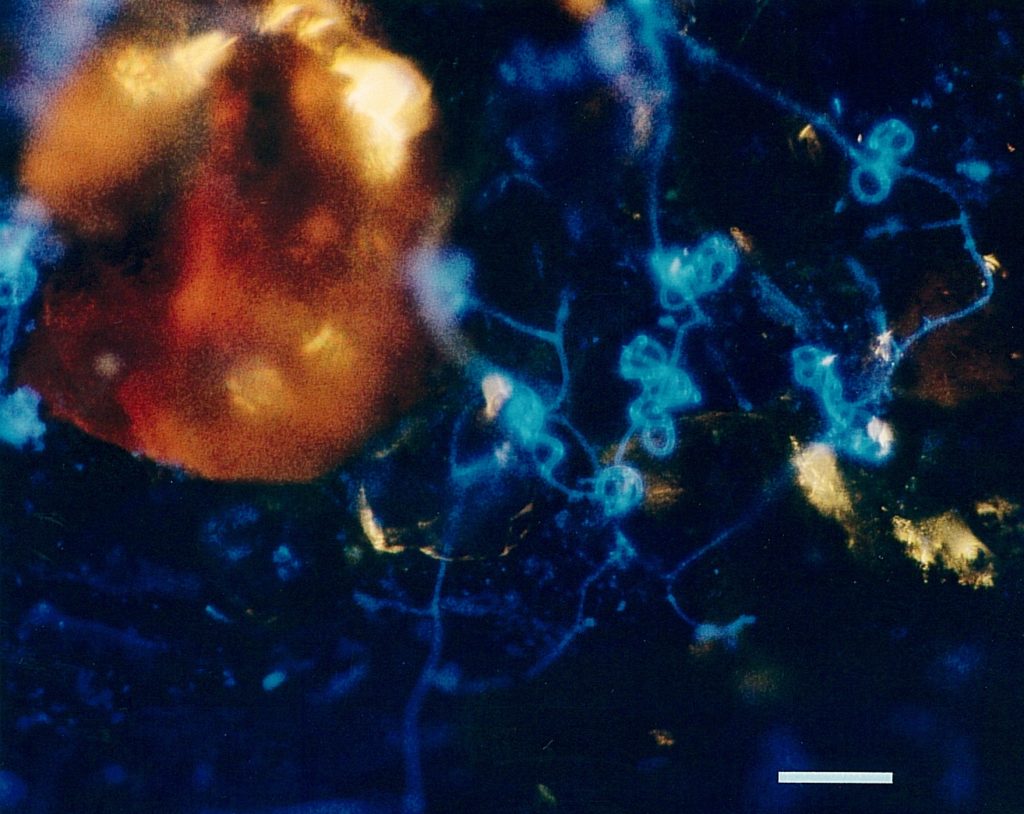
Fig. 4 shows hyphae and capture organs of A. oligospora occupying a larger area; the clusters of „traps“ found often in cultures are clearly visible, in addition to the soil particles which have been illuminated by additional lateral white light. Another type of capture organ, namely the short sticky branches of Monacrosporium cionopagum (Drechsler) is shown in fig. 5. These comparatively simple structures are typical for various Monacrosporium-species and can fuse to give larger structures (see fig. 5b). Such capture organs are typically intensively metabolizing and produce the glue to hold trapped nematodes as well as nematode-digesting enzymes.
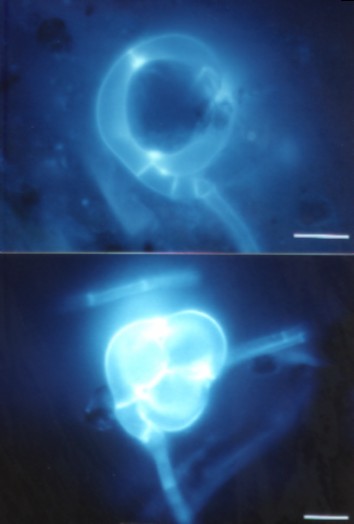
Another group of capture organs, constricting rings are shown in fig 6. These capture organs act by very rapid inflation, triggered when nematode touches the inside of the ring. The three cells enlarge their volume such that the ring is completely filled – the nematode is quickly ensnared and cannot escape. Figure 6 also shows a recently captured nematode, but due to the selectiveness of calcofluor W for glucans, it is stained poorly and hence only visible as a shadow.
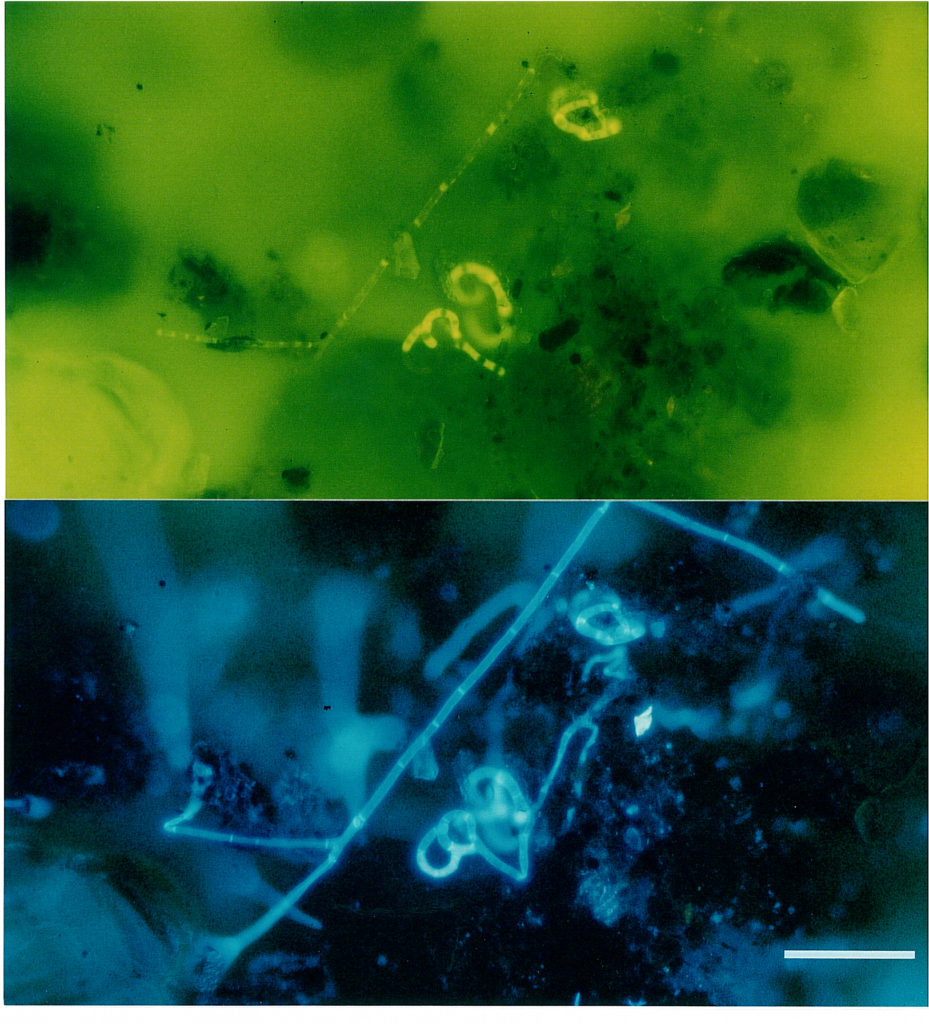
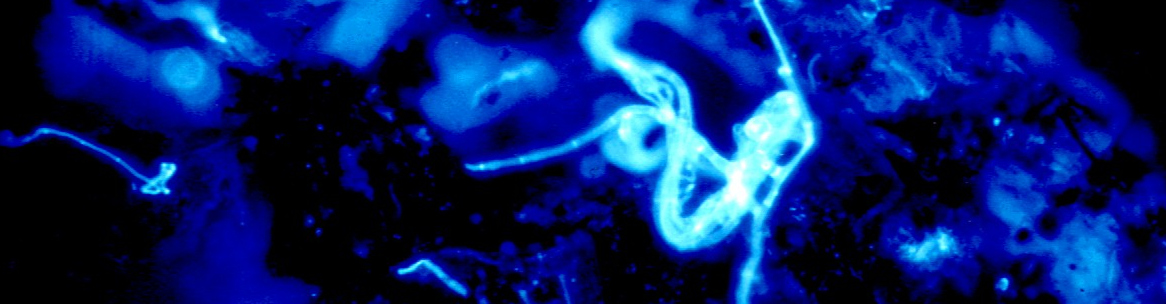
Fig. 7. shows an example of double staining of A. oligospora with FDA and calcofluor. If the filters are chosen adequately, the stains highlight different cellular components: FDA (a) stains actively metabolizing areas such as capture organs, while calcofluor W makes the entire complex visible.
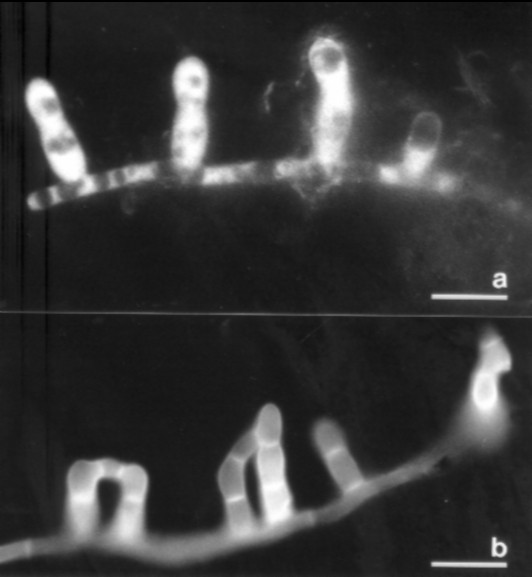
Fluorescence microscopy can be used for the direct observation of a wide range of soil-dwelling fungi, not just the nematophagous fungi studied for this article. Staining of key taxonomic features (for example the developing conidiophores and spores of A. oligospora in fig. 8) make it an ideal tool for the rapid identification of species of fungi that grow actively in soil, and which would be extremely difficult to observe by conventional microscopy. The technique can also be used to study fungal growth in soils over time, which exhibited periodic effects (Jensen et al. 1997). We expect fluorescence microscopy to play an increasing role in environmental mycology. Recently, for example, it has been used to study the colonisation of soils contaminated with urban pollutants (Neumeister, et al. 1995) and to study the occurrence of fungi in the ventilation systems of buildings exhibiting ’sick building syndrome‘ (Neumeister et al. 1996).
References:
COHEN, Y., S. PETER; 0. BALASS & M. D. COFFEY (1987): A fluorescent technique for studying growth of Peronospora tabacina on leaf surfaces.
Phytopathology 77, 201 – 204.
CORREA, B.; A. PURCHIO; C. R. PAULA & W. GAMBALE (1986): Evaluation of a fluorescent method (fluorescein diacetate and ethidium bromide solution) in the study of the viability of Cryptococcus neoformans strains.
Mycopathologia 96, 91 – 96.
JENSEN, C. & G. LYSEK (1991): Direct observation of trapping activities of nematode-destroying fungi in the soil using fluorescence microscopy.
FEMS Microbiology Ecology 85, 207 – 210.
JENSEN, C. (1994): Fluoreszenzmikroskopische Möglichkeiten zur in situ – Beobachtung nematophager Pilze im Boden. Doctoral Thesis, FU Berlin (1993). Dissertationes Botanicae 217; J. Cramer Verlag Berlin, Stuttgart.
JENSEN, C. & G. LYSEK (1995): Fluorescence microscopy of fungi in native soil – improvements by additional substances.
Microscopy and Analysis 1 – 9, Sept. 1995.
JENSEN, C., H. NEUMEISTER & G. LYSEK (1997): Nematophagous fungi – study by fluorescence microscopy and EDX-technique of the periodicity of trap formation in soil.
Biological Rhythm Research Vol. 28, No. 3 (Aug. 1997) 365 – 373
NEUMEISTER, H. (1994): Entwickung einer Präparationstechnik für die energiedispersive Röntgen-Mikroanalyse am Beispiel Arthrobotrys oligospora.
Doctoral Thesis, FU Berlin (1993), Shaker Verl. Aachen 1994
NEUMEISTER, H., M. HESSE & S. QUADER (1995): Wirkung von ausgewählten PAK und PCB auf nematophage Pilze.
Annual Report (Jahresbericht) for the BMFT; GSF-Forschungszentrum für Umwelt u. Gesundheit GmbH. Neuherberg.
NEUMEISTER, H.; M. MORITZ; H. SCHLEIBINGER & H. MARTINY (1996): Investigations on the allergenic potential induced by fungi on air filters of HVAC systems.
Proceedings of Indoor Air ´96; vol. 3, p. 125 – 130; Nagoya/Japan.
NORDBRING-HERTZ, B. (1988): Nematophagous fungi: strategies for nematode exploitation and for survival.
Microbiological Sciences 5; 108 – 116.
SAXENA, G. & G. LYSEK (1993): Observation of nematophagous fungi in natural soils by fluorescence microscopy and their correlation with isolation.
Mycological Research 97, 1005 – 1011.
SÖDERSTRÖM, B. & S. ERLAND (1986): Isolation of fluorescein diacetate stained hyphae from soil by micromanipulation.
Transactions of the British mycological Society 86, 465 – 468.
VON SENGBUSCH, P.; J. HECHLER & U. MÜLLER (1983): Molecular architecture of fungal cell walls – an approach by use of fluorescent markers.
European Journal of Cell Biology 30, 305 – 312.